- The Indian Rupee eases in early Wednesday’s European session.
- Climbing US Treasury yields and substantial foreign outflows may pressure the INR, though RBI intervention could limit further losses.
- Investors look to the advanced US Q3 GDP data for new direction.
The Indian Rupee (INR) trades weaker on Wednesday as rising US Treasury yields and ongoing foreign outflows from Indian stocks apply selling pressure. However, lower crude oil prices may lend some support to the INR, given India’s position as the world’s third-largest oil consumer. Additionally, the Reserve Bank of India’s regular interventions could help limit further depreciation of the INR.
Looking forward, traders are closely watching key US economic data scheduled for later on Wednesday, including the October ADP Employment Change, the preliminary US Q3 GDP report, and September Pending Home Sales. Markets in India will be closed on Friday in observance of Diwali.
Daily Digest Market Movers: The Indian Rupee remains sensitive ahead of upcoming US data releases
- Foreign investors have pulled $10 billion from Indian equities and debt markets in October, marking the highest monthly outflow this year.
- Meanwhile, the RBI forecasts a 7.2% growth for the Indian economy in FY25, with quarterly projections of 7.0% for Q2, 7.4% for Q3, and 7.4% for Q4.
- However, Nomura suggests that India has entered a "cyclical growth slowdown," viewing the RBI's forecast as “overly optimistic.”
- In the US, job openings reached 7.44 million in September, down from August’s revised 7.86 million and missing expectations of 7.99 million.
- The Conference Board’s Consumer Confidence Index rose to 108.7 in October from 99.2 in September, beating estimates of 99.5.
- The CME FedWatch tool indicates a 98.4% probability of a 25 bps rate cut in November.
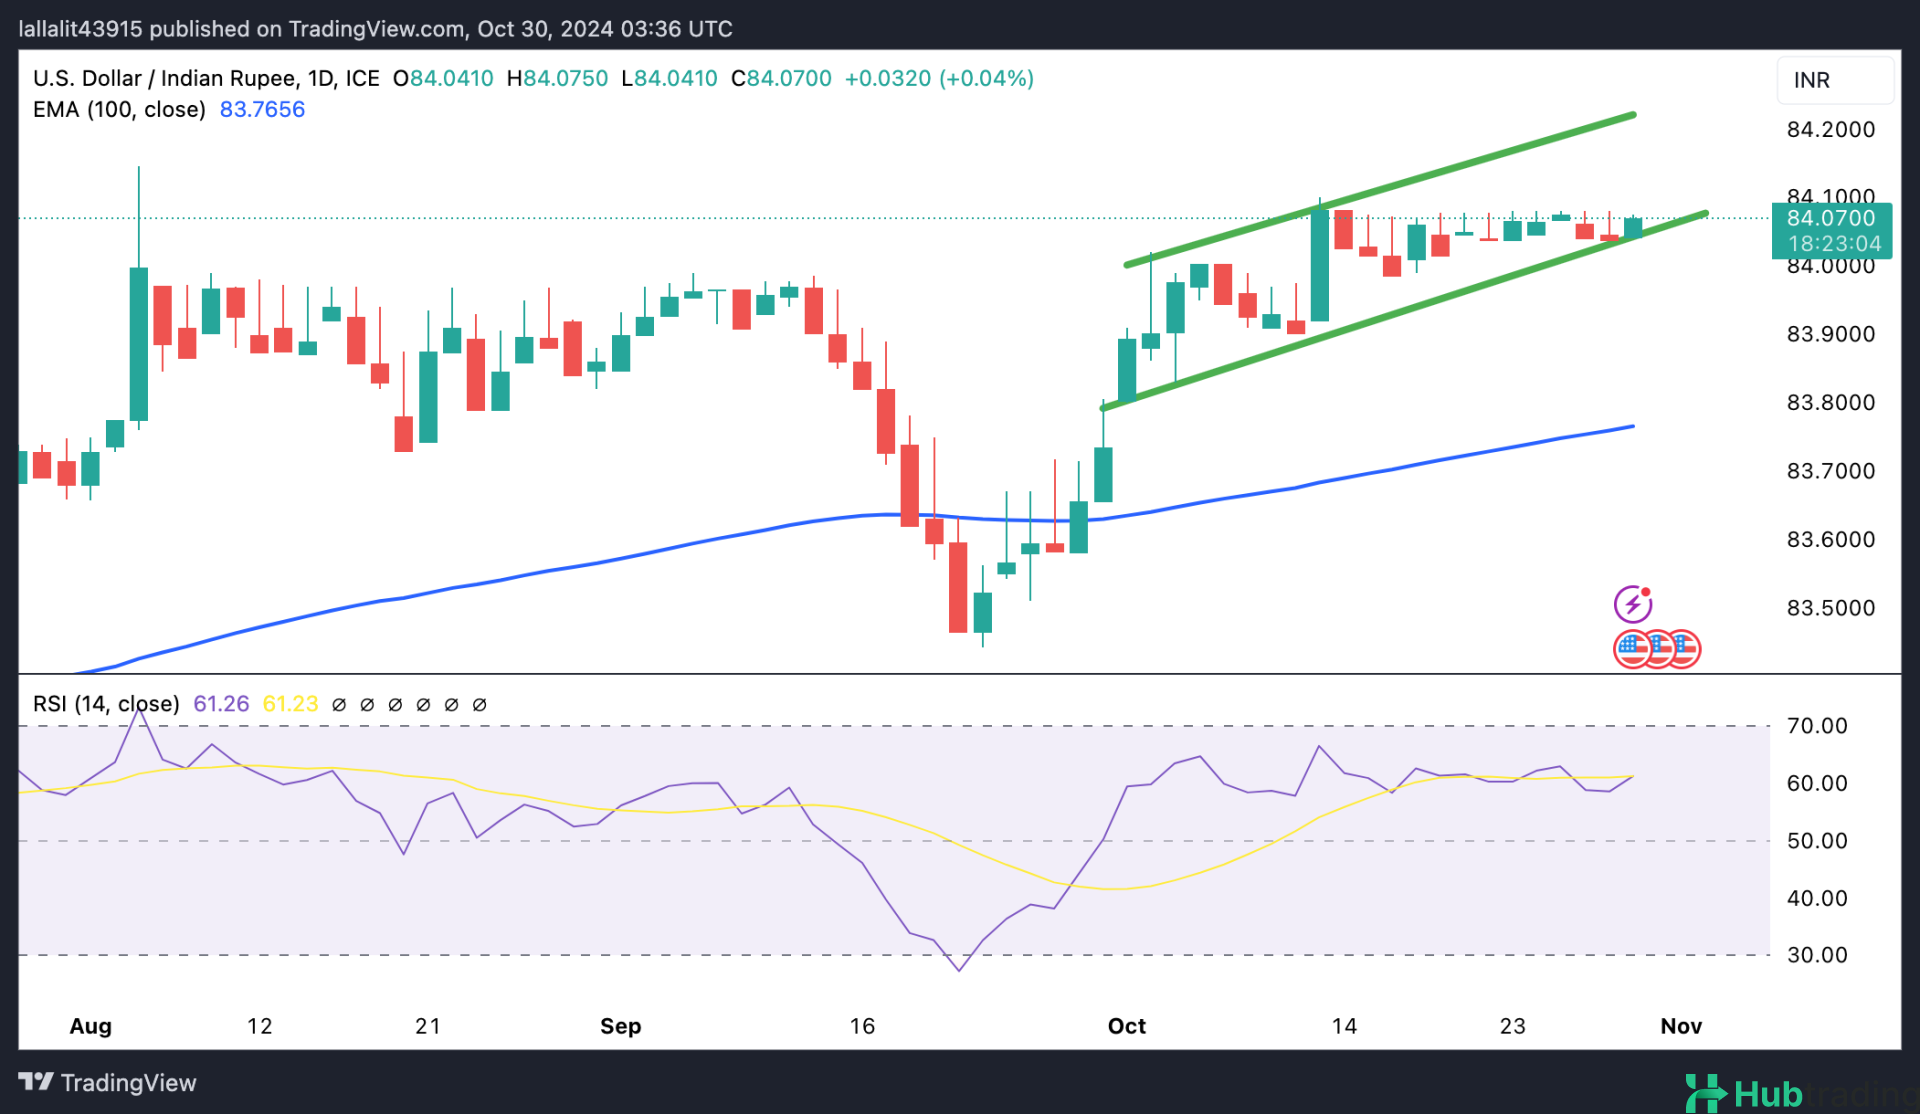
Technical Analysis: USD/INR maintains a bullish outlook over the longer term
The Indian Rupee is trading weaker today. However, the bullish outlook for the USD/INR pair remains intact, with the price staying above the key 100-day Exponential Moving Average (EMA) on the daily chart. The path of least resistance appears to be upward, as the 14-day Relative Strength Index (RSI) is above the midline at approximately 59.20.
Immediate resistance is found at the upper boundary of the ascending trend channel around 84.22. Continued gains could lead to targets at 84.50 and the psychological level of 85.00.
Conversely, sustained trading below the lower limit of the trend channel near 84.05 may expose the USD/INR pair to a potential decline toward 83.76, which corresponds to the 100-day EMA.