- USD/JPY may target initial support at the five-month low of 148.10.
- The pair remains in a descending channel, confirming a persistent bearish bias.
- Immediate resistance is seen at the nine-day EMA of 149.75.
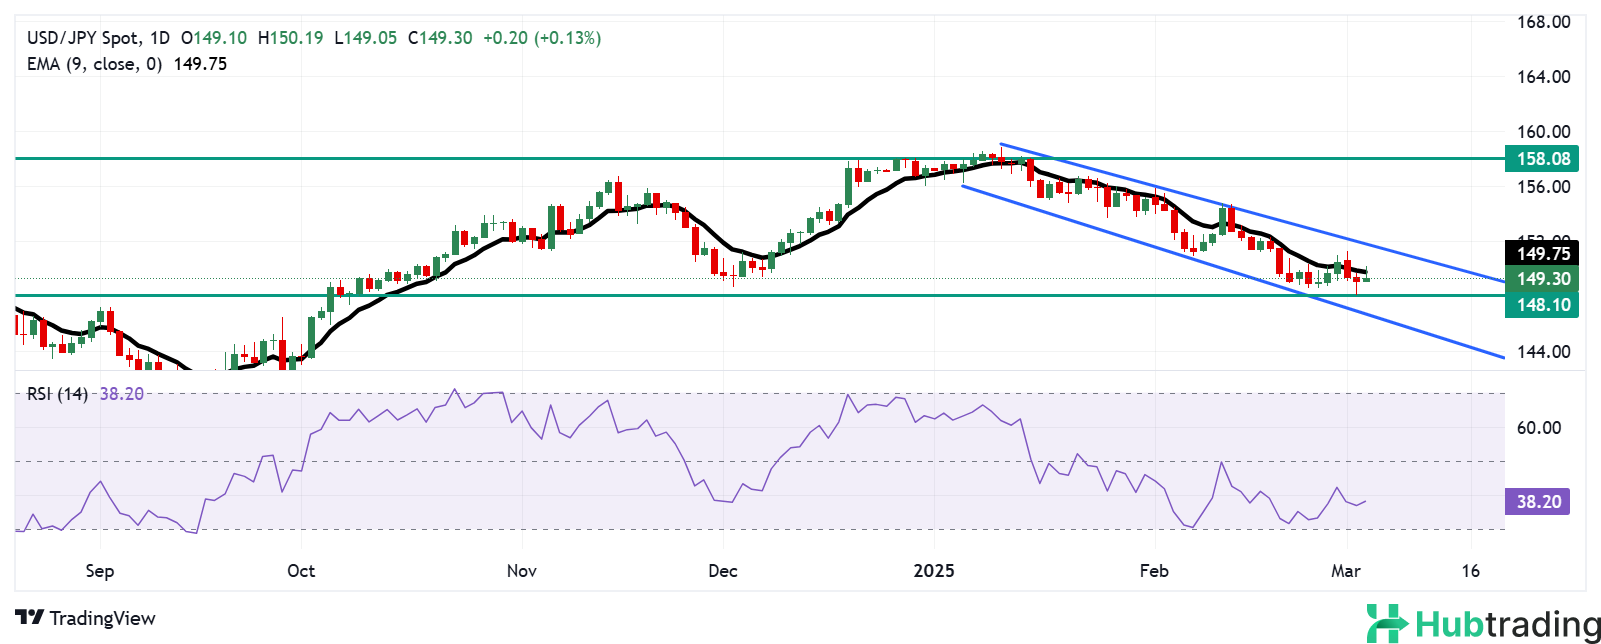
USD/JPY gains traction after two consecutive days of losses, trading around 149.40 during the European session on Wednesday. A daily chart analysis indicates the pair remains within a descending channel, confirming a bearish outlook.
The pair continues to trade below the nine-day Exponential Moving Average (EMA), signaling weak short-term momentum. Additionally, the 14-day Relative Strength Index (RSI) stays above the 30 level, reinforcing the prevailing bearish sentiment.
On the downside, USD/JPY could test initial support at the five-month low of 148.10, recorded on March 4, followed by the psychological support at 148.00. A decisive break below this key zone could intensify selling pressure, pushing the pair toward the lower boundary of the descending channel near 146.70.
Conversely, immediate resistance lies at the nine-day EMA of 149.75. A breakout above this level could strengthen short-term momentum and drive the pair toward the upper boundary of the descending channel near 152.00.
USD/JPY: Daily Chart