William Delbert Gann (1878–1955) was a pioneering trader renowned for his innovative technical analysis methods, which intricately combined price, time, and geometric patterns to forecast market movements. His techniques, such as the Gann angles and the Square of Nine, remain influential among traders seeking to understand the cyclical nature of financial markets.
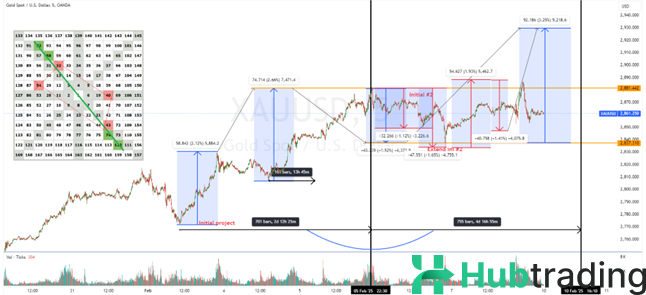
Bellow is the example of square applications in predict price movements of XAU/USD in short term. That’s not an investment advice.
William Delbert Gann (1878–1955) was a pioneering trader renowned for his innovative technical analysis methods, which intricately combined price, time, and geometric patterns to forecast market movements. His techniques, such as the Gann angles and the Square of Nine, remain influential among traders seeking to understand the cyclical nature of financial markets.
Gann's Analytical Framework
Gann's approach was founded on three core premises:
- Price, Time, and Range: He posited that these are the fundamental factors to consider in market analysis.
- Market Cyclicality: Gann believed that markets move in predictable cycles.
- Geometric Design: He asserted that markets operate in a geometric manner.
Based on these principles, Gann developed strategies focusing on:
- Price Study: Utilizing support and resistance lines, pivot points, and angles.
- Time Study: Examining historically recurring dates derived from natural and social means.
- Pattern Study: Analyzing market swings using trendlines and reversal patterns.
Gann Angles
Central to Gann's methodology are the Gann angles, which are diagonal lines drawn on price charts to measure the relationship between time and price. The most significant angle is the 1x1, or 45-degree angle, representing a balance where the market moves up one unit of price for each unit of time. Other notable angles include 2x1 (steeper) and 1x2 (shallower), each providing insights into the market's strength and potential support or resistance levels.
Square of Nine
Another notable tool developed by Gann is the Square of Nine, a spiral of numbers used to determine time and price relationships. Gann believed that the natural order of numbers profoundly impacted market movements. This tool is used for predicting price levels by finding the price of a stock on the square and projecting future prices based on the square’s mathematical progression. It also aids in identifying significant dates when the market is likely to change direction.
Squaring Price, Range, and Time
A cornerstone of Gann's analysis is the concept of "squaring" price with time, which involves balancing the numerical value of a price movement with an equivalent time period. For instance, if a market advances 100 points, Gann would anticipate a significant change in trend after 100 time units (days, weeks, or months), suggesting a harmony between the price range and the time elapsed.
Gann also employed geometric constructions, such as dividing a square into eighths or sixteenths, to create time/price grids. By plotting angles from key points, he identified potential support and resistance levels, enhancing the predictive power of his analysis.
In essence, Gann's methodologies offer a comprehensive framework that integrates price, time, and geometric patterns, providing traders with tools to anticipate market movements with greater precision.
Bellow is the example of square applications in predict price movements of XAU/USD in short term. That’s not an investment advice.


