-
WTI Crude Oil climbs on Monday, snapping a seven-day losing streak and bouncing off a two-month low.
-
Attention turns to the upcoming US-Russia peace talks on Ukraine, set for August 15 in Alaska.
-
Immediate resistance is seen at Friday’s high of $63.89, followed by the 100-day SMA at $64.48 and the 50-day SMA at $66.42, while support levels are noted at $62.36, $61.50, and $60.00.
West Texas Intermediate (WTI) Crude Oil attracted fresh buying interest on Monday, snapping a sharp seven-day losing streak that had pulled prices to their lowest level in two months. The rebound is supported by renewed geopolitical focus, as traders await the upcoming US-Russia peace talks on Ukraine, scheduled for August 15 in Alaska.
The recovery follows a rough week for oil markets, during which WTI lost nearly 5%—its steepest weekly decline since late June—driven by concerns over slowing global demand, escalating trade tensions, and rising OPEC+ output. As of writing, WTI is trading near $63.50, up over 1.0% during the early U.S. session.
Market sentiment is also being shaped by fresh geopolitical developments. Washington’s latest round of sanctions has added pressure on major Russian oil buyers. The U.S. recently imposed a 25% tariff on Indian imports in response to New Delhi’s continued purchases of discounted Russian crude, with similar measures reportedly being considered for Chinese imports.
Any diplomatic progress in the Alaska talks could help lower geopolitical risk premiums and potentially lead to a recalibration of global oil flows—especially if the negotiations pave the way for a phased easing of sanctions on Russian exports. On the other hand, if the talks fail to yield meaningful results, traders may brace for renewed volatility amid fears of tighter supply and increased geopolitical tensions.
Technical Outlook: Key Levels to Watch
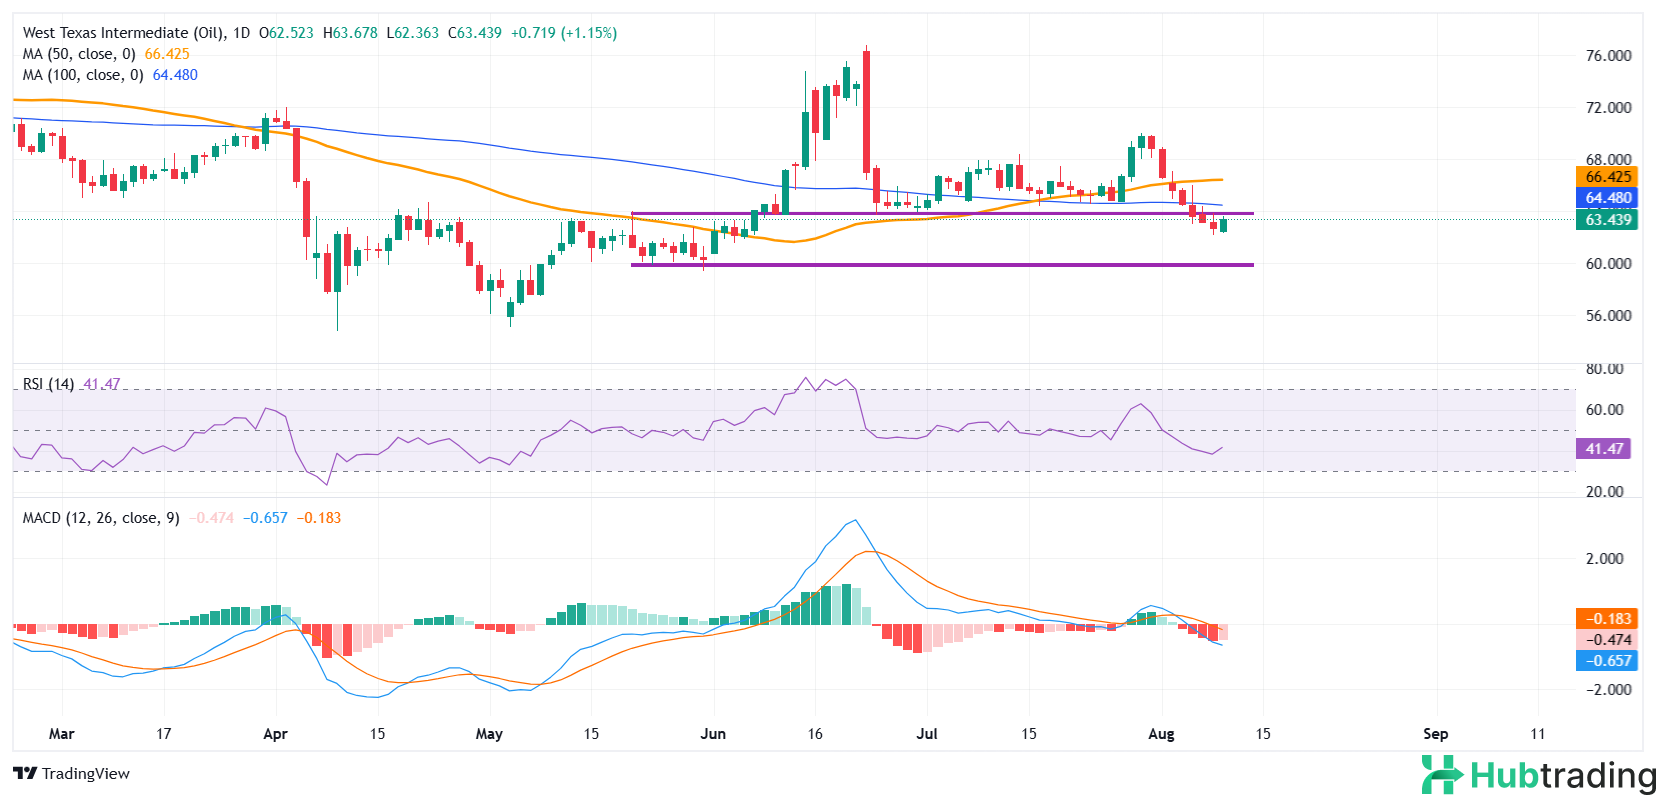
Technically, WTI is attempting to recover from last week’s losses but faces immediate resistance at Friday’s high of $63.89—a former support-turned-resistance level. A break above this level would bring the 100-day Simple Moving Average (SMA) at $64.48 into play, followed by the 50-day SMA at $66.42.
On the downside, initial support lies at the intraday low of $62.36, with additional levels at $61.50. A drop below this zone could expose the psychologically important $60.00 level, a key structural support.
Momentum indicators are mixed. The Relative Strength Index (RSI) has recovered slightly to 42 after nearing oversold territory, suggesting bearish momentum has slowed but not reversed. The MACD remains in negative territory, with the signal line above the MACD line and histogram bars still red—pointing to lingering downward pressure. However, the flattening histogram indicates that selling momentum may be stabilizing, potentially setting the stage for a broader recovery if buying interest builds.


