- The Australian Dollar weakens for a second straight day as risk-off sentiment intensifies.
- Global trade tensions rise as U.S. trading partners brace for a possible letter from Trump announcing unilateral tariffs.
- AUD/USD nears the neckline of a potential Double Top formation, located around the 0.6535–0.6545 zone.
The Australian Dollar (AUD) is trading lower for the second consecutive day, pulling back from its year-to-date high of 0.6590. The retreat comes amid heightened risk aversion as global markets brace for potential trade disruptions, with risk-sensitive assets like the Aussie Dollar feeling the pressure.
Investor sentiment took a hit after U.S. President Donald Trump confirmed on Thursday that he plans to send formal letters to key trading partners outlining new unilateral tariffs, expected to take effect following the July 9 deadline. The announcement has fueled concerns over escalating trade tensions and their potential impact on global commerce—particularly on net-exporting economies like Australia.
Adding to the downward pressure on AUD/USD was Thursday’s stronger-than-expected U.S. Nonfarm Payrolls (NFP) report, which revealed continued strength in the American labor market. The data eased fears of an economic slowdown and dampened hopes for imminent interest rate cuts from the Federal Reserve, giving the U.S. Dollar fresh support.
Technical Outlook: Double Top Formation Signals Bearish Potential
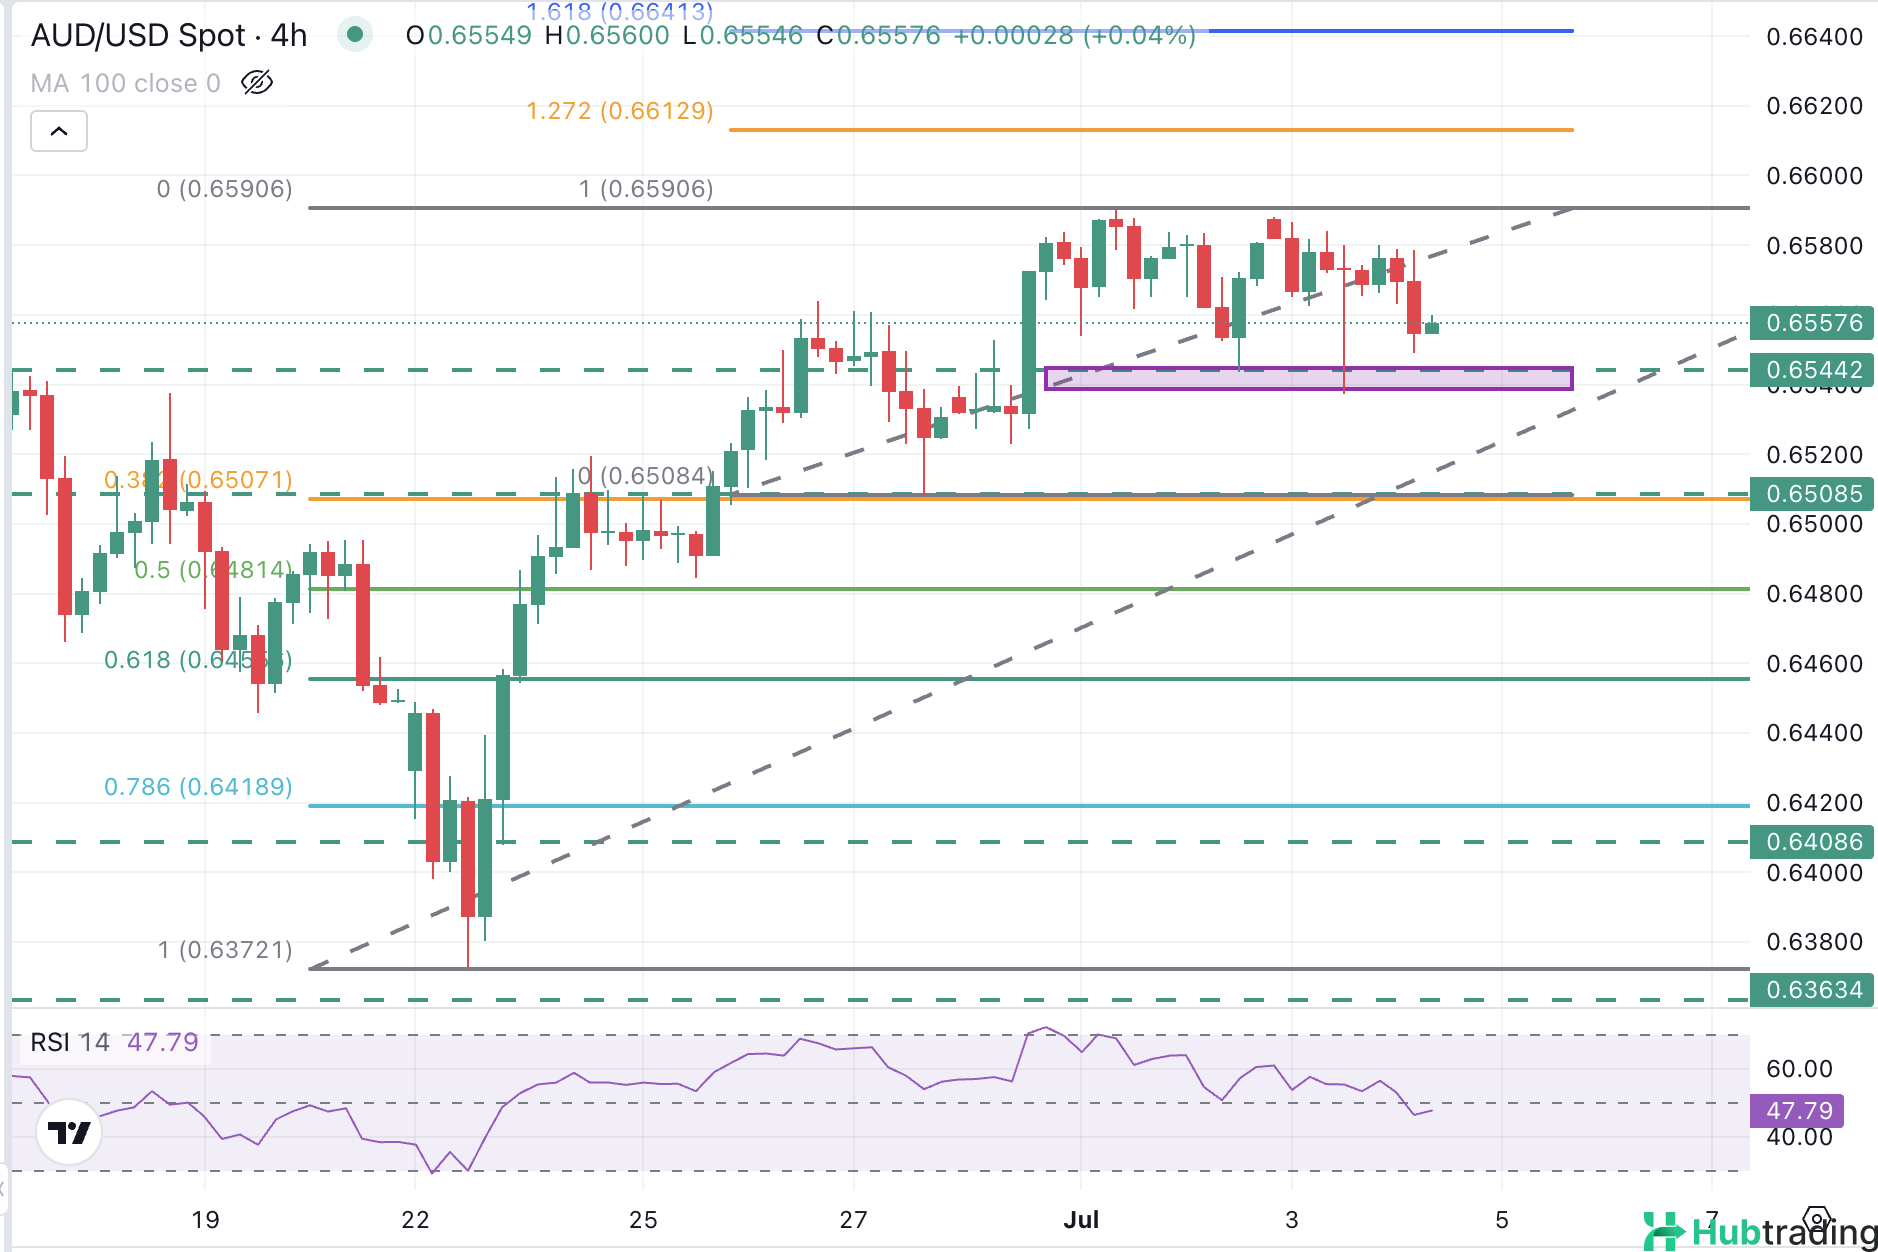
From a technical standpoint, AUD/USD is currently consolidating last week’s gains but is showing signs of a possible trend reversal. A double top has formed at the 0.6590 level—marked by the July 1 and 2 highs—while Thursday’s lower high and the 4-hour Relative Strength Index (RSI) dipping below the 50 mark suggest a shift in momentum toward the bears.
A decisive break below the 0.6535–0.6545 support zone, defined by the July 2–3 lows, would confirm the activation of the double top pattern. This would open the door for a deeper correction, with the next bearish target aligned with the 38.2% Fibonacci retracement of the June 23–July 1 rally and the June 27 low, both converging near 0.6510.
On the flip side, a move above the 0.6590 resistance would invalidate the bearish pattern and restore the broader uptrend. In that case, bulls could set their sights on the next upside targets at the 127.2% and 161.8% Fibonacci extension levels of the June 27–July 1 leg, located at 0.6610 and 0.6640, respectively.


