-
EUR/USD slips as June Nonfarm Payrolls data underscores a strong U.S. labor market, reducing urgency for a July Fed rate cut.
-
Rising U.S. Treasury yields lend additional support to the Dollar ahead of Friday’s Independence Day holiday, which may affect market liquidity and volatility.
-
The pair encounters near-term resistance at the key psychological level of 1.1800.
The Euro (EUR) is weakening against the U.S. Dollar (USD) during Thursday’s American session, as a solid batch of U.S. economic data offers renewed support to the Greenback.
After climbing to a multi-year high of 1.1830 earlier this week, EUR/USD is now trading below the key 1.1800 level, with momentum stalling in response to robust labor market figures.
The focus on Thursday shifted to the June Nonfarm Payrolls (NFP) report, as traders looked for further clues on the timing of potential Federal Reserve rate cuts. The data beat expectations, with 147,000 jobs added in June—surpassing the forecast of 110,000 and slightly above May’s 144,000. The unemployment rate edged down to 4.1% from 4.2%, while wage growth remained steady. These figures reinforce the strength of the U.S. labor market, easing immediate pressure on the Fed to lower interest rates.
Other key labor metrics, including labor force participation and wage trends, continue to suggest stable inflation dynamics, further supporting the U.S. Dollar. As a result, U.S. Treasury yields saw a modest uptick, adding to the Dollar’s recovery ahead of the U.S. Independence Day holiday, which may impact market liquidity.
Technical Analysis: EUR/USD Faces Resistance at 1.1800
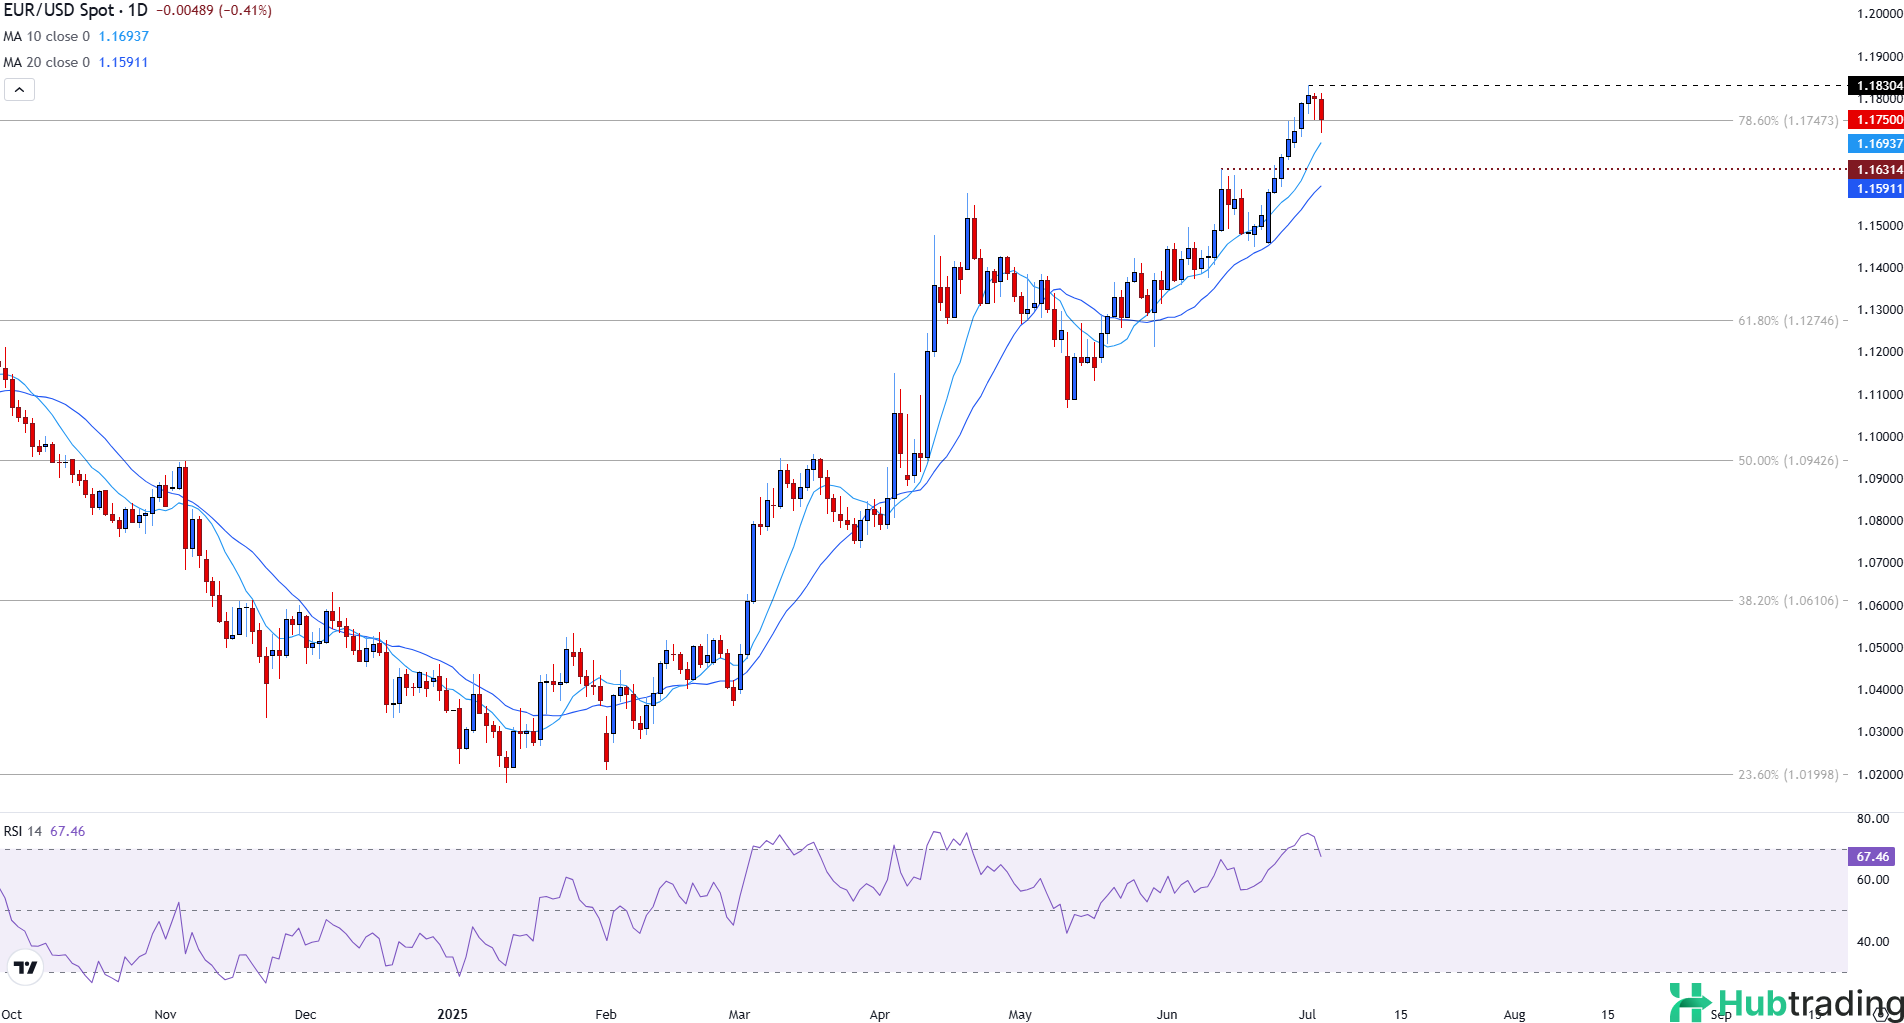
The EUR/USD pair recently demonstrated strong bullish momentum, rallying to a high of 1.1830. However, the move triggered profit-taking, with the pair now pulling back below the key psychological resistance at 1.1800.
Despite the retracement, the broader trend remains constructive. The pair is still trading above both the 10-day and 20-day Simple Moving Averages (SMA), which are currently positioned at 1.1695 and 1.1592, respectively. Both SMAs are sloping upward, suggesting underlying bullish momentum in the short to medium term.
The Relative Strength Index (RSI) on the daily chart hovers near 68—just below overbought territory—indicating strong upward momentum, though a brief consolidation phase or shallow correction could occur.
In a bullish scenario, holding above the 1.1695 support zone could lead to renewed buying interest. A successful retest and breakout above 1.1830 would open the door for further gains, potentially extending the uptrend.


