-
The US Dollar Index struggles to regain footing on Thursday, hovering near the 101 level after failed rebound attempts.
-
Renewed tariff escalations and dovish signals from the Fed have intensified concerns over recession and inflation, putting added pressure on the Greenback.
-
Technical outlook remains bearish, with firm resistance around 102.30 and limited support below current levels.
The US Dollar Index (DXY) continues to decline on Thursday, trading near the 101 level after failing to sustain its earlier recovery momentum. The latest drop comes in the wake of new US tariff measures that raise the effective rate on Chinese imports to a hefty 145%, while maintaining a 10% baseline for other nations.
These developments have sparked concern among Federal Reserve (Fed) officials, who caution that the sudden trade escalation could exacerbate inflationary pressures and strain the labor market.
Daily Market Movers: Fed flags inflation risks amid rising trade tensions
-
The White House's confirmation of the tariff hike on Chinese goods has rattled markets, with fears mounting that consumer prices will surge as a result.
-
Fed officials, including Dallas Fed President Lorie Logan and President Jeff Schmid, have warned that unexpected trade policy moves could lead to job losses and complicate monetary policy decisions.
-
Initial jobless claims edged up to 223,000, while continuing claims declined to 1.85 million, signaling mixed labor market signals.
-
Despite lingering inflation concerns, Fed speakers have not directly addressed the March CPI release, though markets remain highly sensitive to upcoming inflation data.
Technical Analysis: Bearish trend remains intact
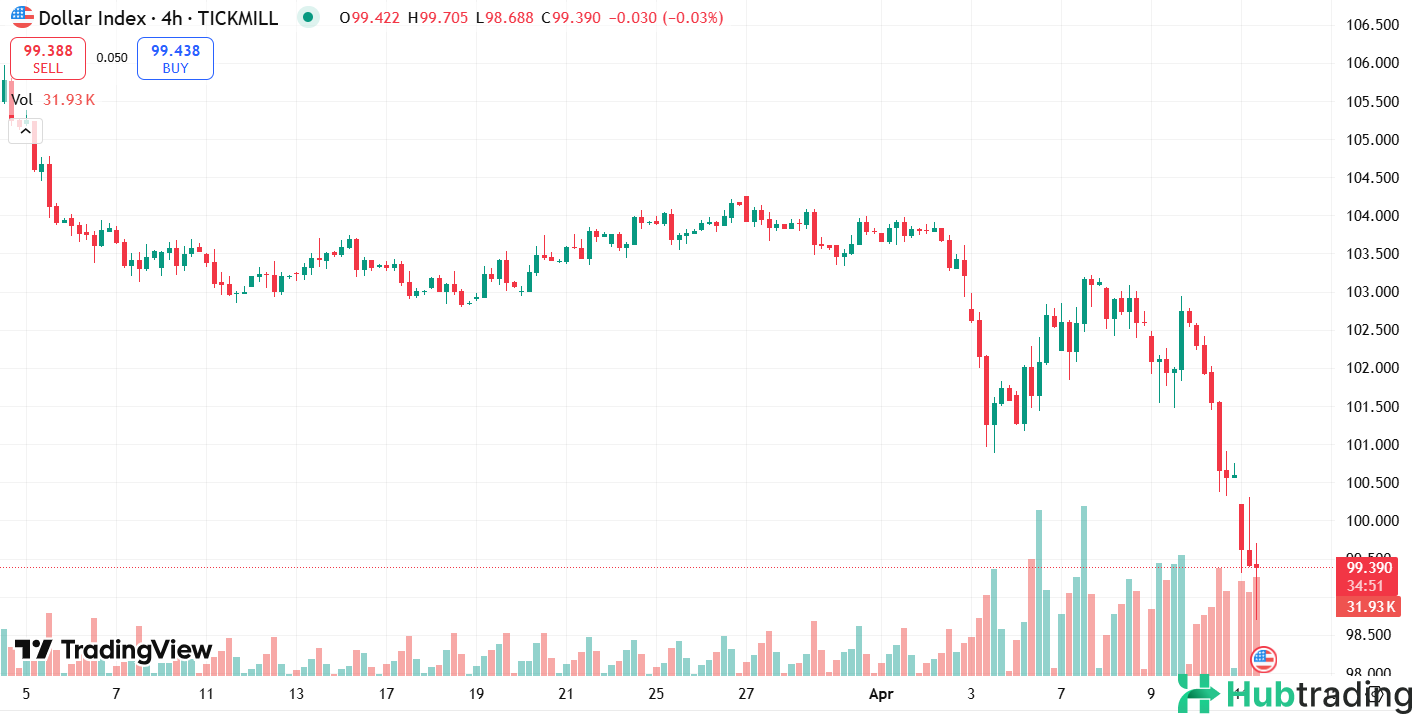
Technically, the US Dollar Index shows persistent weakness, staying near the lower boundary of its recent range around 101. The MACD continues to flash a sell signal, reinforcing bearish momentum, while the RSI sits just above oversold territory at 29. The Awesome Oscillator remains neutral, though Momentum (10) suggests continued downside potential. The bearish bias is further supported by downward-sloping moving averages: the 20-day SMA at 103.52, 100-day SMA at 106.48, and 200-day SMA at 104.79. A break below current levels could accelerate losses, while resistance is noted at 102.29, 102.72, and 102.89.


